
wxChartDir
wxChartDir contains C++ classes supporting the commercial graphics library ChartDirector in wxWidgets applications.

wxChartDir - Support for using the ChartDirector charting library in wxWidgets applications
Description
ChartDirector is an extremely versatile, stable and affordable charting library, that supports many different chart types like
- pie,
- donut,
- bar,
- line,
- spline,
- step line,
- trend line,
- curve-fitting,
- inter-line filling,
- area,
- band,
- scatter,
- bubble,
- floating box,
- box-whisker,
- waterfall,
- contour,
- heat map,
- surface,
- vector,
- finance,
- gantt,
- radar,
- polar,
- rose,
- pyramid,
- cone,
- funnel
and more. Charts can be created as vector graphics in PDF and SVG and as raster graphics in PNG, JPG, GIF and BMP. Please visit the ChartDirector gallery to get an impression of the capabilities of this library.
wxChartDir includes the following charting controls:
- wxChartViewer
a wxWidgets control that inherits fromwxPanelandViewPortManager. A viewport can be imagined as a rectangular window of an underlying rectangular surface. - wxViewPortControl
a wxWidgets control that inherits fromwxPanelandViewPortControlBase. A viewport control is a user interface element to let the user visualize and manipulate the viewport managed by the ViewPortManager.
Included with wxChartDir are wxWidgets based versions of all sample applications coming with ChartDirector as well as additional sample programs, which can be downloaded from the ChartDirector website. Many of them demonstrate the various types of interactive charts. ChartDirector itself only contains source code for QT- and MFC-based sample programs.
Another C++ command line program allows you to generate a large number of additional sample graphics in a single run (see subfolder cppdemo).
All relevant parts of the ChartDirector trial version for C++ are included in the wxChartDir distribution. This allows to compile and test the sample applications without having to download and install ChartDirector separately.
The ChartDirector trial version is fully functional, but will produce yellow banner messages at the bottom of the generated chart images. To eliminate these banners the purchase of a ChartDirector license is required.
The wxChartDir documentation generated with Doxygen is available online. Alternatively, it can be downloaded from the corresponding GitHub-Branch.
An overview article about wxChartDir was published in the wxWidgets Developer-Blog.
Examples
Figure 1 shows a crosshair cursor with a tooltip for data points and data value labels on the axes.
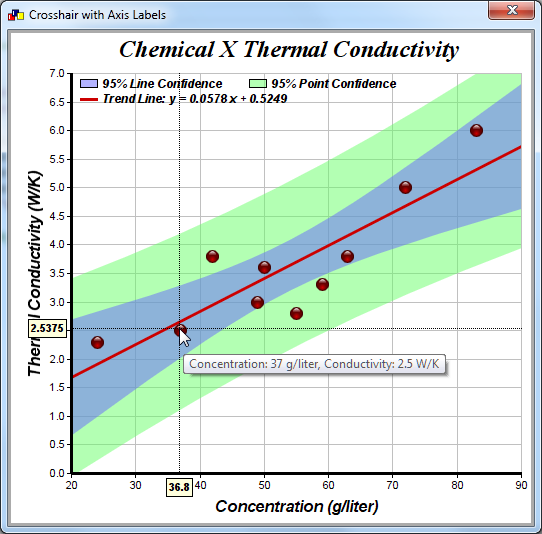
Figure 2 shows the display of realtime data allowing to measure the distance between data points selected by positioning 2 track lines.
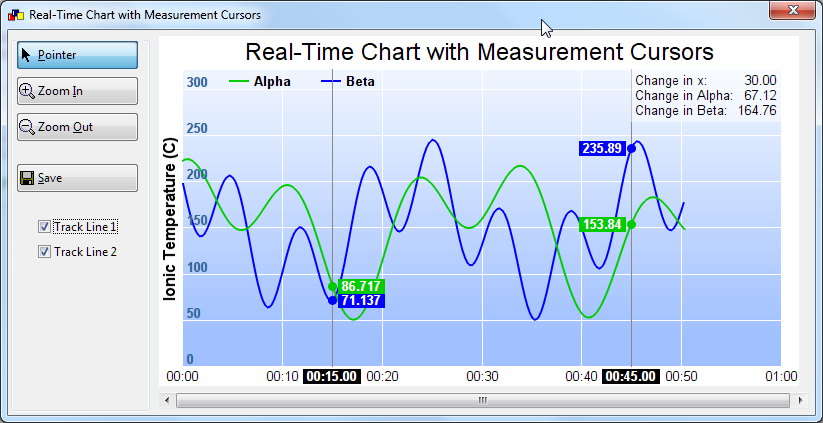
Figure 3 shows the zooming and scrolling of the viewport via a viewport control.
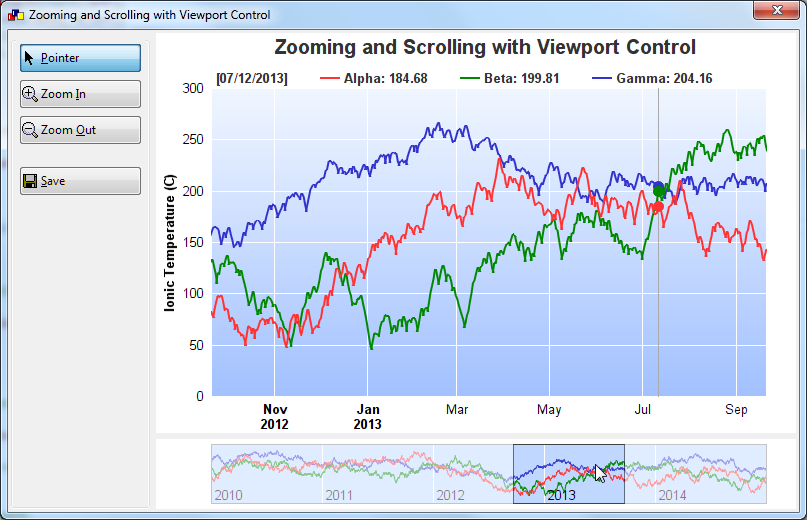
Figure 4 shows the visualization of 3D data.
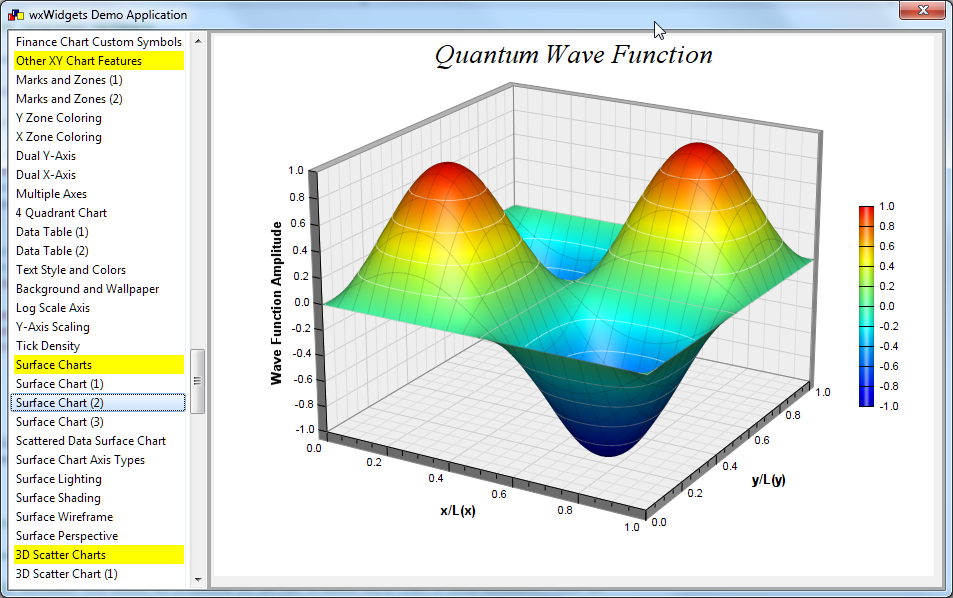
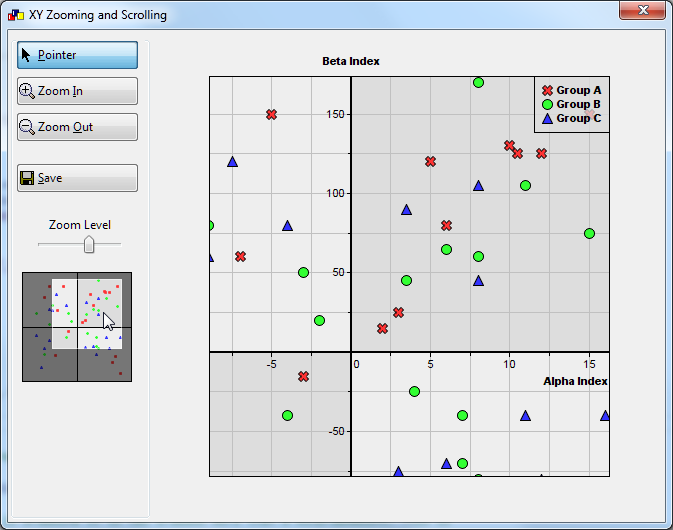
Figure 5 shows the feature to zoom and scroll in 2 dimensions.
History
A detailed version history can be found in the change log.